By clicking “Accept All Cookies”, you agree to the storing of cookies on your device to enhance site navigation, analyze site usage, and assist in our marketing efforts. View our Privacy Policy for more information.
What is the relationship of market consensus earnings growth forecasts for a market (aggregated bottom-up from company data)¹ and future country returns?
To answer this question, for each of the MSCI Developed and Emerging markets, each month, we looked both at the consensus forecasted earnings growth for the current year (after all one does not know the actual earnings growth for the current year until early the following year) as well as the consensus forecasted earnings growth for the following year. We correlated both the earnings growth forecast for the current year and the earnings growth forecast for the following year with each market’s MSCI returns over 3 periods:
Over the next 3 months
Over the next 6 months
Over the next 12 months
We cover 23 developed and 24 emerging markets as defined by MSCI. The study utilizes a database and returns covering a 30-plus year period from January 1990 through March 2023 for most developed markets and from August 1992 through March 2023 for many emerging markets. The charts below show the average correlation for developed, emerging, and all markets of forecasted earnings growth with market returns over 3 different periods of time.
These results suggest that at the market level there is little correlation in the near term (3,6, and 12 months out) with earnings growth forecasts and stock prices at the market level.
Commodity Price Trends and Equity Market Returns ¹
The current geopolitical risk in the Middle East puts even more into focus commodity price trends and their effect on equity markets. When commodity prices are trending higher, do commodity exporting markets do better and commodity importing do worse? And vice versa. When commodity prices are trending lower, do commodity exporting markets do worse and commodity importing markets do better. In other words, can the trend of export prices relative to import prices be useful in allocating the equity markets?
The Heckman Global Allocation Model² uses a smart beta (factor based) approach to allocating the global markets using a set of 13 valuation and macro-economic investment factors. The model can evaluate the efficiency of each factor for allocating markets on a standalone basis as well as a combination of factors. To test whether the trend of export vs import prices be useful in allocating the equity markets, we created a terms-of-trade index based on the imported or export composition for each market and the price of four different exported and imported items – fuel, metal/minerals, agriculture, and manufacturing. For each market, we compare today’s index vs where the index was 18 months ago. For example, if oil prices have gone up compared to where they were 18 months ago, large oil exporters such as Norway or Brazil would have positive terms-of-trade. Conversely, under these circumstances over the same time period, if a market is a large oil importer, such as Japan, its terms-of-trade would be negative. Conversely, when the price of oil has gone down compared to where it was 18 months ago, Norway’s terms-of-trade would become negative and Japan’s positive (as an oil importer). We tested whether overweighting markets with positive terms-of-trade and underweighting markets with negative terms-of-trade was a strategy that produced alpha over a benchmark.
Starting with benchmark country capitalization weights, we re-balanced the country allocation monthly by assigning overweights to markets with higher-than-average terms-of-trade and underweights to markets with lower-than-average terms-of-trade. Each country gets an overweight or underweight allocation relative to the benchmark that is roughly in proportion to the difference between its score and the cross-market average score (with restrictions on the maximum allocation possible to small markets to avoid unrealistically large exposures). The allocation coming the Heckman model is updated each month and performance returns (gross and net of estimated transactions costs) are calculated monthly. Returns are then measured relative to the relevant universe benchmark returns.
Results of Standalone Backtests
The annualized alphas for overweighting markets based on its terms-of-trade trend on a standalone basis using the Heckman Global Allocation model are shown in the following figures. The tests were done across the markets in the MSCI All-Country World Index (ACWI) which include both the developed and emerging markets, across the markets in the MSCI All-Country World Index (ACWI ex US) which include both the developed and emerging markets but excluding the U.S., across the markets in the MSCI World Index (all the developed markets), and across the markets in the MSCI Emerging Market Index (all the emerging markets). Figure 1 shows the hypothetical annualized alphas (gross and net of estimated transaction costs) from January 1990 through November 2023. Figure 2 shows the hypothetical annualized alphas (gross and net of estimated transaction costs) more recently from January 2014 through November 2023³.
What the charts show is the trend in export and import prices can be useful for allocating equity markets. Over the whole period starting in January 1990, it has been most useful for allocating the ACWI markets, the ACWI (excluding the U.S.) markets, and the Emerging Markets. In contrast, allocating markets based on export prices relative to import prices appears to have offered less alpha in allocating the developed markets. In particular, over the last 10 years, performance of the developed markets has been dominated by outperformance of the U.S. market and by tech - rather than by export vs import prices movements.
Figure 1
Source: Heckman Global, IMF, World Trade Organization, U.S. Bureau of Economic Analysis. Past performance is not indicative of future results. Indices are presented herein for illustration purposes only. The stated net return is hypothetical and is not based on assumptions about an actual portfolio in any single vehicle and does not reflect actual investor returns.
Figure 2
Source: Heckman Global, IMF, World Trade Organization, U.S. Bureau of Economic Analysis. Past performance is not indicative of future results. Indices are presented herein for illustration purposes only. The stated net return is hypothetical and is not based on assumptions about an actual portfolio in any single vehicle and does not reflect actual investor returns.
¹ For Institutional Investors Only
² The Heckman Global Allocation Model is a hypothetical model. Performance results were not actually achieved by any portfolio of the adviser.
³ January 1990 is when the Heckman Global Model started. The Model data goes back to January 1990, and 2014 was trying to represent as close to the recent 10 years
DISCLOSURE:
For Institutional Investors Only. This publication is provided by Heckman Global Advisors (“HGA”), which is not an independent entity but is a Division of DCM Advisors, LLC, a registered investment adviser. The views herein are solely those of HGA and may differ from those of other business units of DCM Advisors, LLC and are subject to change without notice. Nothing contained herein constitutes an offer to sell or a solicitation of an offer to buy any security or any interest in DCM Advisors, LLC vehicle(s).
All investments are subject to the risk of loss, including the potential for significant loss, and it should not be assumed that any models or opinions incorporated herein will be profitable or will equal past performance. Past performance is no guarantee of future results. All returns are illustrative based on the assumptions as outlined. There can be no assurance that the returns could have been achieved or avoid substantial losses. The information contained herein has been obtained from sources believed to be reliable but is not necessarily complete and its accuracy cannot be guaranteed.
Indices are presented herein for illustration purposes only as the Heckman Global Allocation model does not intend to track any index or benchmark. The MSCI All-Country World Index (ACWI) , which includes both the developed and emerging markets, is designed to represent performance of the full opportunity set of large- and mid-cap stocks across 23 developed and 24 emerging markets.
The MSCI All-Country World Index (ACWI ex US) which includes both the developed and emerging markets but excluding the U.S., captures large, mid and small cap representation across 22 of 23 Developed Markets (DM) countries (excluding the United States) and 24 Emerging Markets (EM) countries
The MSCI World Index (all the developed markets),is a free float-adjusted market capitalization weighted index that is designed to measure the equity market performance of developed markets. The MSCI Emerging Market Index (all the emerging markets) is a free float-adjusted market capitalization index that is designed to measure equity market performance in the global emerging markets.
These materials are the exclusive property of DCM Advisors, LLC. Unless otherwise expressly permitted by DCM Advisors, LLC in writing, please do not distribute, reproduce or use these materials for any purpose other than internal business purposes solely in connection with the management of investment funds or investment products that are sponsored or advised by you. This publication is not considered a Research report under FINRA Rule 2241(a)(11) and related rules.
What is the Relationship between Market Earnings Growth Forecasts and Market Returns?
What is the relationship of market consensus earnings growth forecasts for a market (aggregated bottom-up from company data)¹ and future country returns?
To answer this question, for each of the MSCI Developed and Emerging markets, each month, we looked both at the consensus forecasted earnings growth for the current year (after all one does not know the actual earnings growth for the current year until early the following year) as well as the consensus forecasted earnings growth for the following year. We correlated both the earnings growth forecast for the current year and the earnings growth forecast for the following year with each market’s MSCI returns over 3 periods:
Over the next 3 months
Over the next 6 months
Over the next 12 months
We cover 23 developed and 24 emerging markets as defined by MSCI. The study utilizes a database and returns covering a 30-plus year period from January 1990 through March 2023 for most developed markets and from August 1992 through March 2023 for many emerging markets. The charts below show the average correlation for developed, emerging, and all markets of forecasted earnings growth with market returns over 3 different periods of time.
These results suggest that at the market level there is little correlation in the near term (3,6, and 12 months out) with earnings growth forecasts and stock prices at the market level.
Do Markets with Higher GDP Growth Forecasts Have Higher Returns?
It is commonlypresented in the media that the higher the GDP growth means the market will have higher performance. In this article, we test this commonly held view using the Heckman Global Allocation Model.
The Heckman Global Allocation Model uses a smart beta(factorased) approach to allocating the global markets using a set of 13valuation and macro-economic investment factors. The model can evaluate theefficiency of each factor for allocating markets on a standalone basis as well combination of factors. We tested on a standalone basis for allocating markets both forecasted GDP for thecurrent year (since one does not know actual GDP until way into the followingyear) and forecasted GDP for the next year using monthly data from January 1990through September 2. (Source: Heckman Global and Consensus Economics)
For each factor we calculated a score for every market each month based on how high the market’s forecasted GDP growth (for current year or next year) is relative to the average market. Starting with benchmark country capitalization weights, we re-balance the portfolio by assigning overweights to markets with higher-than-average forecasted GDP growth and underweights to markets with lower than average forecasted GDP growth. Each country gets an overweight or underweight allocation relative to the benchmark that is roughly in proportion to the difference between its score and the cross-market average score (with restrictions on the maximum allocation possible to small markets to avoid unrealistically large exposures). The portfolio is updated each month and performance returns (gross of transactions costs) are calculated monthly. Returns are then measured relative to the relevant universe benchmark returns.
Results of Standalone Backtests
The annualized alpha for overweighting markets on a standalone basis testing both measures of GDP forecasts (current year and next year) is shown in Figures 1 and 2. The tests were done across the MSCI All-Country World (ACWI) markets which include both the developed and emerging markets, across the MSCI World markets (the developed markets), and across the MSCI Emerging markets. The alpha was negative whether we tested forecasts for the current year or for next year. In other words, the media hype that higher GDP forecasts for a market translate into higher returns relative to other markets does not necessarily hold up.
There has been a lot ofdiscussion on the strength of the U.S. dollar over the past several years andits relationship with rising interest rates. The common belief is that when interest rates in the U.S. rise, the dollar will strengthen. SinceDecember 31, 1988 through August 31, 2023, we have looked at thereal exchange rate [1]ofthe U.S. dollar, which compares the valuation trend of the U.S. dollar relativeto its trading partners and its relationship with changes in the Fed fundsrate. The change in Fed funds rate which we measured is the difference between the Fed fundsrate and its 24-month average. Below is a chart of the two – U.S. dollar realexchange rate valuation and changes in Fed Funds rate.
Source: Heckman Global
Below is a table of the correlation between real exchange rate valuation and the change in Fed funds rate. For the whole time, the correlation is low . However, if the period is broken up into periods when the Fed policy has been tight, then the correlation is overall positive.
Source: Heckman Global
** Our data only starts late in that tightening cycle
Heckman Global's Conclusion: When the Fed policy has been tight, the valuation of the real exchange rate of the U.S. dollar tends to be positively correlated with changes in Fed Funds rate.
[1] The real effective exchange rate index as a weighted average ofthe CPI-adjusted exchange rates of the U.S. with respect to its six largesttrading partners. Our real exchange rate valuation factor is measured as thedeviation, in percent, of the most recent level of the U.S. dollar realexchange rate from its six-year moving average.
Risks, whether global coming from a global crisis, such as the Covid pandemic and high inflation, or local, such as a controversial presidential election, can be reflected in the level of Credit Default Swaps (CDS) on government debt. The CDS reflects the perception of sovereign default risk but also can reflect economic and geopolitical risks which can in turn affect equity markets. The Covid pandemic, high inflation, a global slowdown, the war in Ukraine, build-up of global debt, and the recent rise in oil prices are some of the recent global risks. In March 2023, during the lead up to the U.S. debt ceiling crisis, we gave an analysis of 5-year CDS spreads around the world. Looking at the CDS markets currently, what are they telling us about risks of the global markets?
Most noticeably, U.S.CDS started to rise in April 2022 connected to the debt ceiling crisis and the banking sector stress and reached a local peak in March 2023. It is currently rising again with the possible government shutdown.
Italian CDS tends to be an outlier. It rose dramatically during the early days of the Covid crisis in 2020 and rose again in July 2022 with the resignation of Prime Minister Draghi and the subsequent September 2022 election of Meloni. German and French CDS tend to be low and steady, rising modestly during the early days of the Covid.
U.K. CDS rose dramatically in September 2022 connected to Liz Truss’s budget proposal. U.K. CDS has subsequently declined but stabilized.
Japanese CDS are low and steady, rising modestly during the early days of the Covid pandemic. Indian CDS tend to be higher than those in China, Korea, and Japan. They spiked during the early days of the Covid pandemic. Chinese, Indian, and Korean CDS spreads started to rise again in the Spring of 2022 with first the possible default on U.S. debt and stayed elevated in the Fall of 2022 with rising global interest rates and risk of a U.S. recession. Subsequently they have declined.
In general, Latin American CDS spreads tend to be higher than for Asian emerging markets. Over the period looked at, Brazil’s CDS spreads tend to be higher than most other markets causing our scaling for CDS to be increased on this graph. All three Latin American CDS rose during the early part of the Covid pandemic and also, like Asian CDS, rose during the Spring/Fall of 2022 with the possible default on U.S. debt, rising global interest rates, and risk of a U.S. recession. Like Asian CDS, spreads have declined since the Fall of 2022.
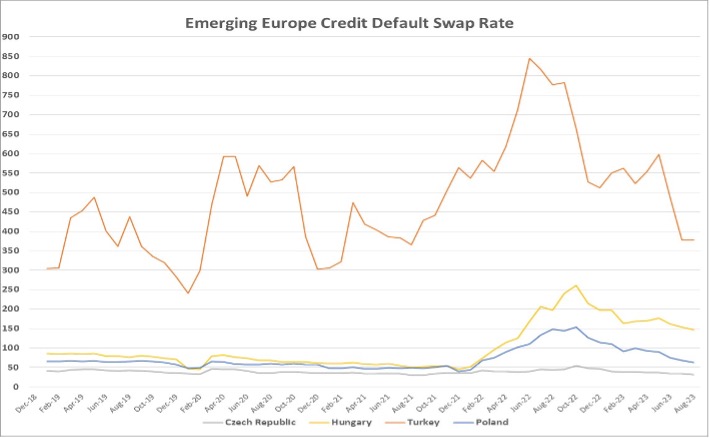
Turkish CDS is perennial outlier causing the scaling of the graph to be increased even beyond Latin America. Turkish CDS rose during the Covid crisis in 2020 and again considerably in the Spring 2022 with the Russian invasion of Ukraine. They rose again during the Turkish Presidential election in Spring 2023 but have fallen since then. Hungarian and Polish CDS rose in the Fall of 2022 most likely with the increase in inflation and proximity to the war in Ukraine. Czech Republic CDS have been narrow and steady.
Conclusion
Globally CDS spreads are currently tending to narrow, except for a modest increase in two important markets - U.S. and China. The modest widening for the U.S. is possibly explained by the looming government shutdown. For China, it can perhaps be explained by the Chinese economic slowdown and real estate crisis. We are hoping that the risks in both these markets can be contained.
How Has Short-term Momentum Work for Allocating the Global Markets?
It seems that with the rise of social media and business news channels one would hypothesize that the time period for measuring momentum as a factor in allocating equity markets has gotten shorter. This analysis looks to see if using 3-month momentum would have added value to country allocation – especially over the most recent years.
The Heckman Global Equity Allocation Model uses a smart beta (factor based) approach to allocating the markets. Currently, in the Heckman Country Allocation Model, we use 13 investment indicators which fall into the categories of valuation, growth, risk, monetary policy, and momentum. Under momentum, we currently use momentum measured over the last 12 months for each market. This analysis tests whether shorter term momentum (3 months) would have added value as a factor for country allocation. In other words, if one overweights markets with higher 3-month momentum and underweights markets with lower 3-month momentum, would this strategy have outperformed the relevant MSCI index return.
In the Heckman Global Equity Allocation Model, we calculate a score for every market each month based on the indicators. Using momentum as an example, we start with MSCI benchmark country capitalization weights, and we rebalance the portfolio by assigning overweights to markets with higher-than-average momentum and underweights to markets with lower-than-average momentum. Each country gets an overweight or underweight allocation relative to the benchmark that is roughly in proportion to the difference between its score and the cross-market average score (with restrictions on the maximum allocation possible to small markets to avoid unrealistically large exposures). The portfolio is updated each month and performance returns (gross of transactions costs) are calculated monthly. Returns from the strategy can then be measured relative to the relevant MSCI benchmark returns.
In this analysis, we constructed the 3-month momentum factor in two ways: in local currency terms and in $US terms. There were two country universes tested: MSCI All-Country World universe (developed and emerging) and MSCI Emerging Market universe. We divided the alpha into 10-year periods since January 1989 and with the most period being January 2019 through July 2023 – obviously less than 10 years.
For the MSCI ACWI universe, as can be seen from the Charts 1 and 2, a positive alpha was produced for the first two ten-year periods from January 1989 through December 1998 and January 1999 through December 2008. However, for January 2009 through December 2018 and the most recent period of January 2019 through July 2023, this factor for country allocation would have produced negative alpha relative to the MSCI ACWI Index return.
Chart 1
Chart 2
For the MSCI Emerging Universe, as can be seen from the Charts 3 and 4, the 3-month momentum factor measured in local currency would have outperformed from January 1989 through December 2008. This is not the case of the $U.S. 3-month momentum factor since it underperformed during the January 1989 through December 1998. In addition, since January 2009, there is no clear pattern for outperformance over the MSCI Emerging Market Index either when the 3-month momentum is measured in local currency or in $U.S.